Tiny Tv
Take a peek at the test results here,
or read on to see how they were acquired.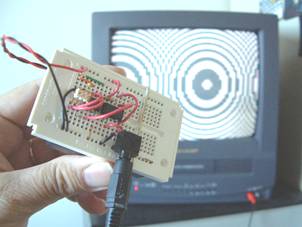
TinyTv generating circles using the finite difference method.
Background
This project represents the convergence of three other projects that I have explored as part of my work as a hands-on methodologist.
- VideoCircles -- Realtime evaluation of a polynomial equation by finite difference methods can be realized as hardware or simple software that runs at video rates. This spreadsheet compares the finite difference [1] method to direct evaluation of the polynomial as an excel formula.
- TinyTv -- Software that generates NTSC video signals, such as test patterns or simple readouts, using programmed i/o in a low cost microcontroller [2] and a resistor network for the video dac.
- Codosome -- An object model of microcontroller hardware and software that can make the practices of ExtremeProgramming workable in a resource starved environment. Codosome includes a java simulator that can run partially written microcontroller programs.
Fixtures
Two new fixtures were created corresponding to the two types of tables found in the VideoCircles spreadsheet.
- Coefficients -- This table contains the five input parameters to the computation corresponding to the coefficients (a through e) of the polynomial, ax^2 + by^2 + cx + dy + e.
- Values -- These tables contain intermediate or final results organized as an x-y grid that corresponds to the x-y raster that television uses to paint the screen. Each row corresponds to a horizontal scan line. Each cell of a row holds the value that a variable will take on at the corresponding moment of the scan.
- http://c2.com/doc/Codoso ... oefficients.java -- Reads the coefficients for a particular problem. The coefficients are saved so that a new Codosome simulation can be constructed at will.
- http://c2.com/doc/Codosome-2/Values.java -- Checks the values of a particular variable at every point in the video raster. This fixture is unusual in that it picks up the name of the variable to check from the first row of the table.
Results
A word document was prepared describing the computation to be performed by the TinyTv implementation of VideoCircles. Tables were copied from the VideoCircles spreadsheet and edited to include the fixture names on the first line of each table.
- http://c2.com/doc/Codoso ... VideoCircles.xls -- The original spreadsheet from which expected results were drawn. You will need Microsoft Excel to read this file.
- http://c2.com/doc/Codoso ... VideoCircles.htm -- The acceptance test input pepared with Microsoft Word and saved as html. You will need a fairly recent browser to read this file.
- http://c2.com/doc/Codoso ... irclesOutput.htm -- The marked up acceptance test showing results from the Codosome simulation.
References
Return to WelcomeVisitors